What Columns Should an Evidence Table for a Systematic Review Include?
TL;DR
There is no single “perfect” evidence table for a systematic review.The right columns depend on your research question, decision context, and planned analysis.
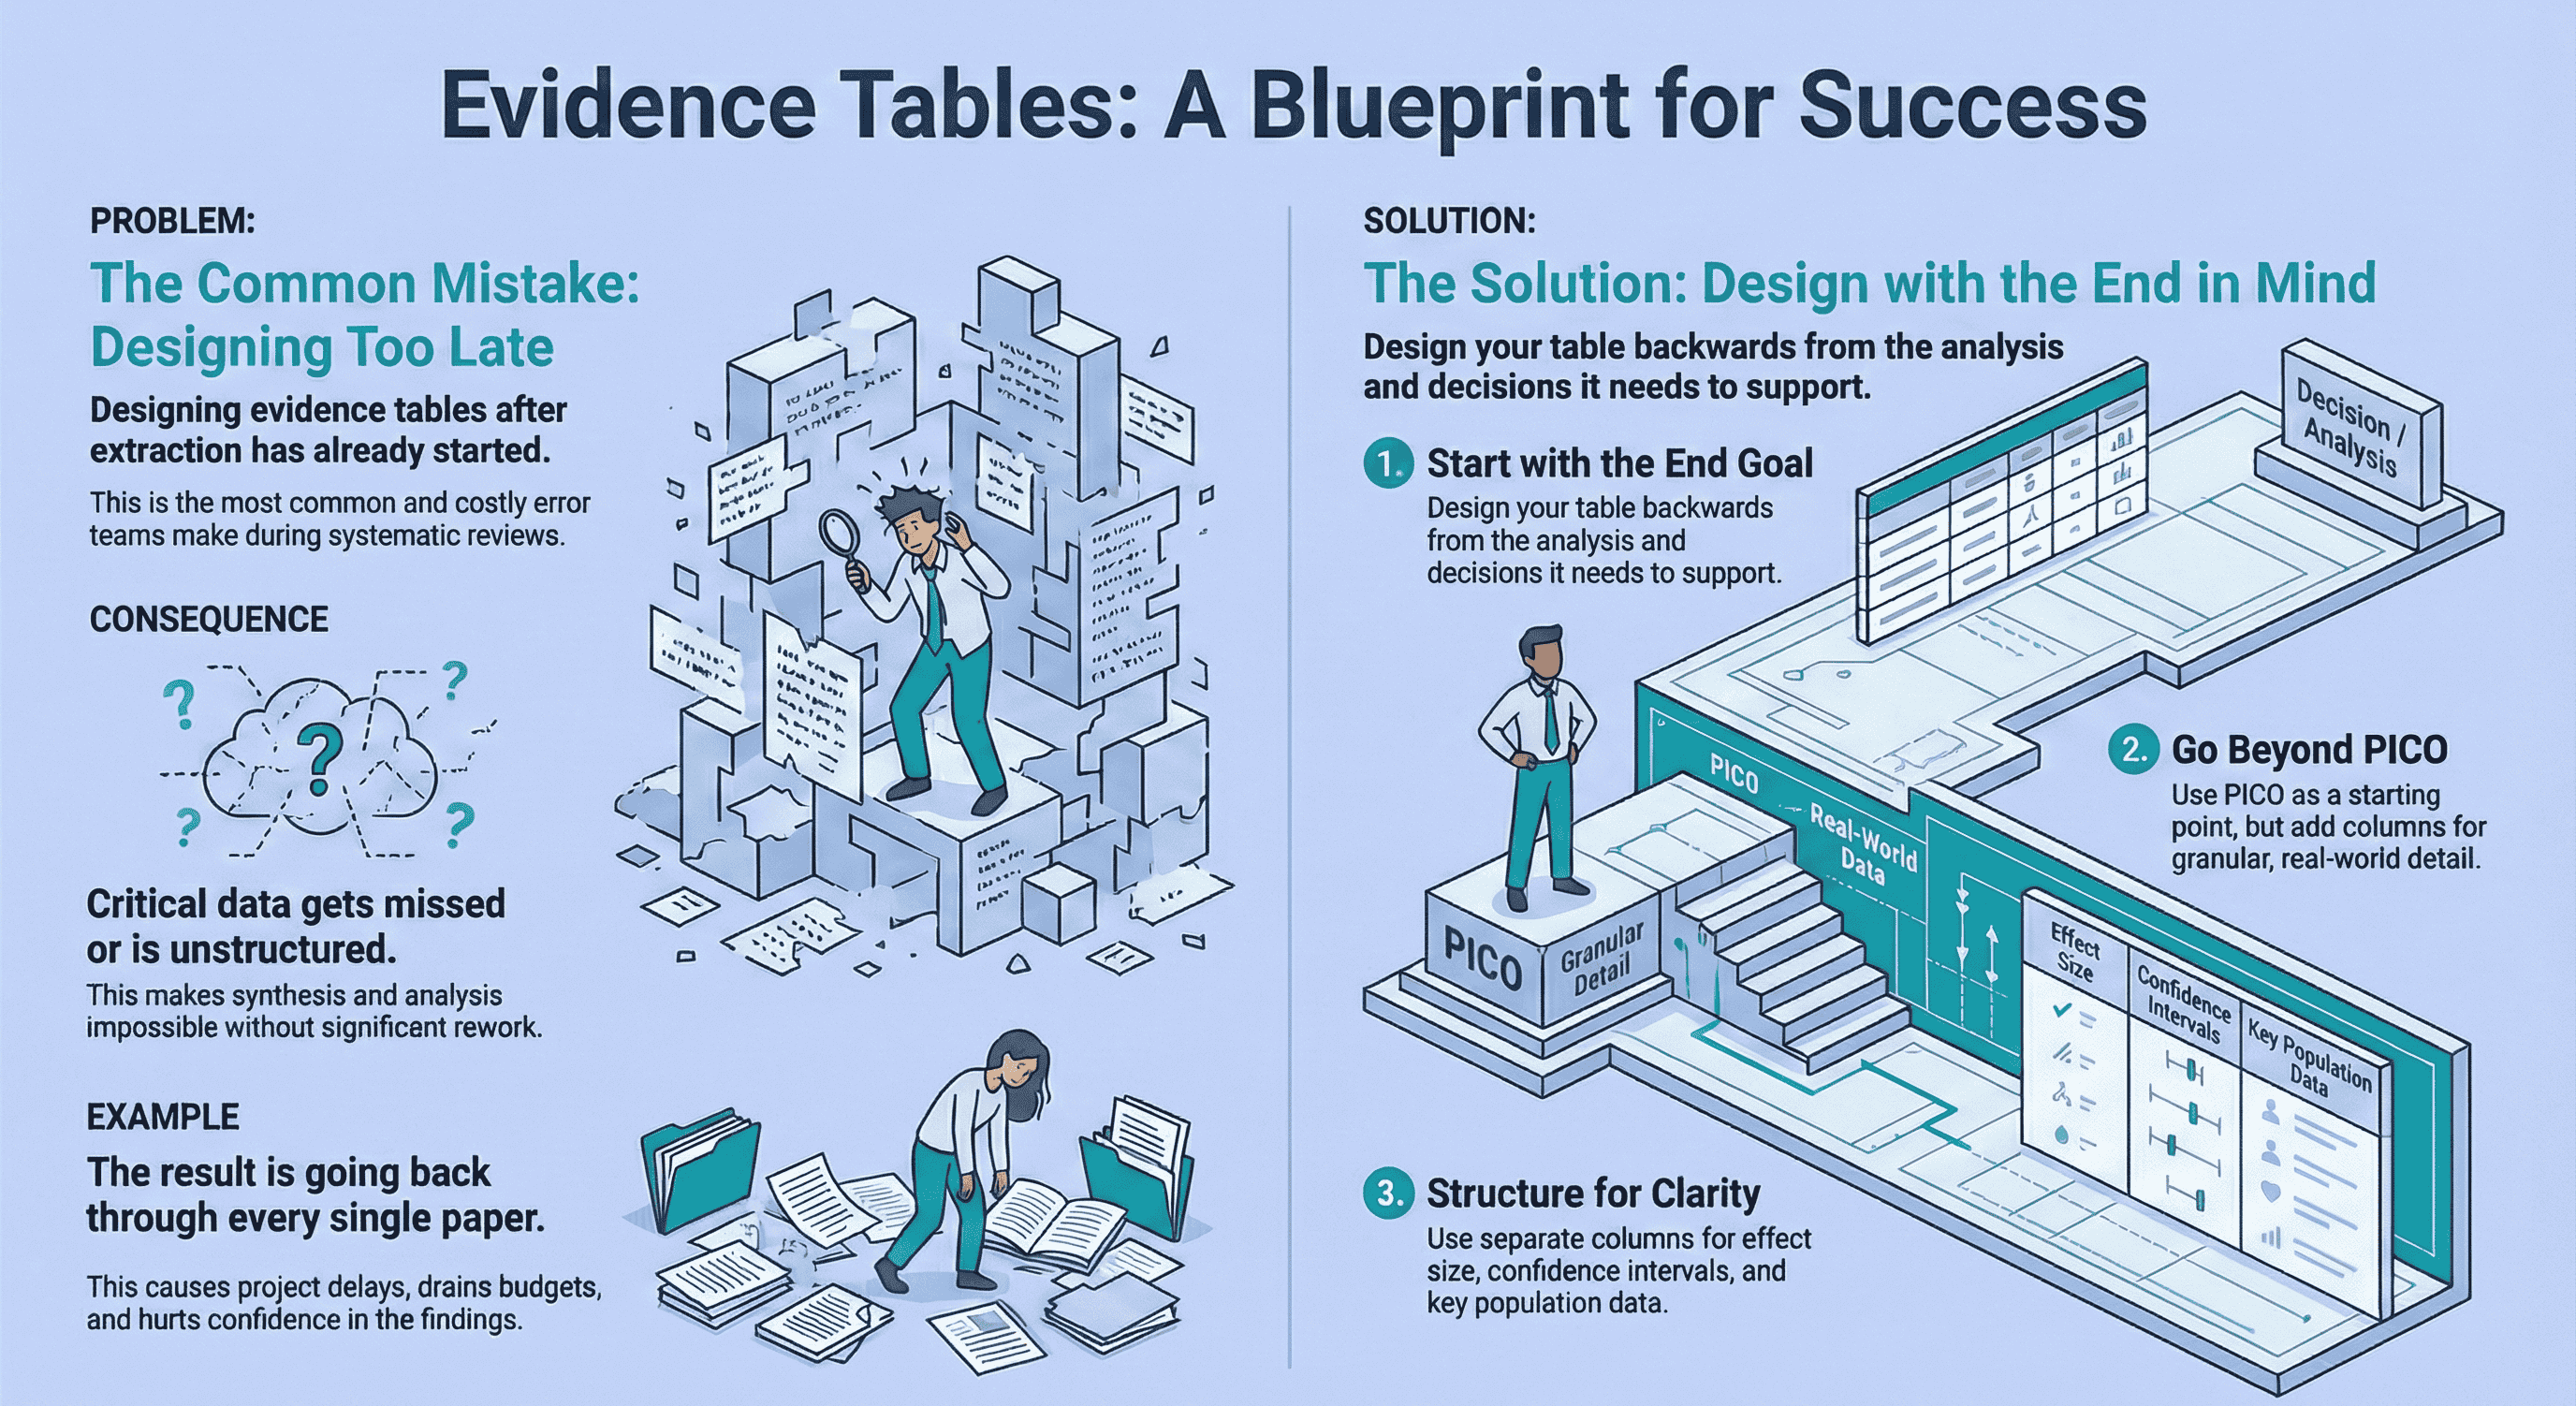
The biggest mistake teams make is designing evidence tables after extraction has already started. Instead, design your table backwards from the synthesis stage, not the PDFs.
Use standard templates only as a starting point.Expand beyond PICO where needed, structure population and outcome data clearly, and separate effect sizes from confidence intervals.
A well-designed evidence table prevents rework, supports defensibility, and makes downstream analysis faster and calmer.
If you work in pharma, HTA, or medical devices evidence tables are not an academic formality. They are part of an audit-ready decision trail.
I’ve seen evidence tables determine whether:
- a clinical evaluation report holds up under regulatory scrutiny,
- a health technology assessment can be defended,
- or a project quietly collapses under rework, delays, and missed endpoints.
This article answers a deceptively simple question:
What columns should an evidence table include for a systematic review?
The honest answer is: it depends.
But there are principles that consistently separate robust, defensible tables from painful ones.
And those principles always point back to one thing: designing for analysis, not extraction.
Why Evidence Table Design Matters More Than Most People Realise
The most common mistake I see is not poor extraction , it’s poor planning.
Teams often get very good at “getting through papers”, only to realise later that:
- critical outcomes weren’t captured,
- population variables weren’t structured,
- or effect measures weren’t extracted in a way that supports synthesis.
At that point, the evidence table stops being a tool and becomes a liability.
A real example from medical devices
On a project involving a Left Atrial Appendage Seal (CLAAS) system, we extracted a large volume of procedural and safety data across ~90 studies.
Only later did we realise that key outcomes like mortality and ischaemic stroke hadn’t been structured correctly.
The result? We had to go back through every single paper and re-extract data.
That wasn’t a research problem. That was an evidence table design problem.
If this scenario feels familiar, it usually means the extraction workflow wasn’t piloted or stress-tested early. I’ve written more about how to avoid exactly this kind of rework in my guide on best practices for data extraction in systematic reviews.
How to Choose Column Headings Based on Your Review Question
The first rule is simple but often ignored:
Your evidence table should be designed backwards from the analysis stage.
Before you define a single column, ask:
- What decisions will this evidence support?
- What comparisons need to be made?
- What subgroup or sensitivity analyses are likely?
This forward-planning mindset aligns closely with reporting frameworks such as PRISMA 2020, which explicitly require clarity on data items and outcomes to support transparent synthesis.
Use PICO , but don’t stop there
PICO is a useful starting framework, but it’s often too rigid for applied decision-making.
In practice:
- Interventions need granularity (dose, duration, device iteration, operator experience)
- Comparators are rarely uniform
- Outcomes often fragment into safety, efficacy, procedural, and long-term follow-up domains
Treat PICO as scaffolding, not a cage.
Outcome selection is where evidence tables often become “complete but unusable.” This guide helps you choose outcomes based on the planned synthesis: How to Choose Outcomes for an Evidence Table: Quantitative vs Qualitative Reviews.
A well-designed table expands PICO to reflect how the data will actually be used downstream.
Core Columns Every Defensible Evidence Table Needs
Study identification
These anchor traceability and auditability:
- Author / Year
- Study ID or citation reference
- Country and setting (hospital, registry, outpatient, etc.)
- Funding source / conflicts of interest (critical in regulated contexts)
Study design and methods
These explain how the data was generated:
- Study design (RCT, cohort, registry, single-arm)
- Sample size (total and per arm)
- Follow-up duration
- Comparator definition
Without these columns, synthesis becomes guesswork.
What Columns Show Study Population and Setting Clearly
Population ambiguity is one of the fastest ways to undermine conclusions.
In applied reviews, the following are non-negotiable:
- Age
- Gender
- Geographic location
These variables materially influence outcomes and generalisability.
Other characteristics (baseline severity, comorbidities, inclusion/exclusion criteria) should be included only if they inform interpretation or subgroup analysis.
Extracting population data “just in case” is fine , as long as it’s structured and intentional.
How to Report Effect Sizes and Confidence Intervals in a Table
If outcomes are central to decision-making, they deserve clarity.
My strong preference is:
- Separate columns for effect size
- Separate columns for confidence intervals
- Optional p-value columns where relevant
Why? Because lumping everything into one cell makes:
- synthesis harder,
- QA slower,
- and downstream analysis brittle.
Effect estimates should be readable without interpretation. If someone has to re-calculate or re-format your table, the design has failed.
Evidence Table Columns Template (Evidence Table Example)
Use this as a starter “evidence table columns template” for most quantitative systematic reviews. Add or remove columns based on the decision context and planned analysis.
| Column group | Example columns |
|---|---|
| Study identification | Author (year), citation ID, country/setting, funding/conflicts |
| Design & methods | Design, arms, sample size, follow-up, comparator definition |
| Population | Eligibility criteria, baseline characteristics, key subgroups |
| Intervention / comparator | Dose/device iteration, duration, co-interventions |
| Outcomes | Outcome definition, timepoint, measurement instrument |
| Results | Effect size, CI (separate), events/denominators (if needed), p-value (optional) |
| Quality / bias | Risk of bias tool + rating (and key notes) |
| Notes & traceability | Reporting quirks, caveats, source pointer / quote location |
If you want to decide outcomes more deliberately (quantitative vs qualitative synthesis), see: How to Choose Outcomes for an Evidence Table: Quantitative vs Qualitative Reviews.
Examples of Evidence Tables for Randomized Controlled Trials
RCT evidence tables are often over-engineered.
A defensible RCT table usually includes:
- Study design and randomisation method
- Population characteristics
- Intervention and comparator details
- Pre-specified primary and secondary outcomes
- Effect size + CI
- Risk of bias assessment
Anything beyond that should earn its place.
If a column doesn’t support synthesis, comparison, or regulatory justification, it shouldn’t be there.
Where Risk of Bias Fits (Quality Review Tool Columns)
To support defensibility:
- Include a risk of bias / quality rating
- Flag statistical significance clearly
- Add a concise “key findings” or “notes” column
This is not for narrative summaries. It’s for surfacing issues reviewers and assessors will ask about later.
In health technology assessment and regulatory contexts, evidence tables are expected to support transparent appraisal and justification. Organisations like NICE explicitly frame evidence handling as part of an auditable decision process, not just a reporting exercise.
If you’re choosing a risk-of-bias / critical appraisal framework, this guide helps match the tool to your study designs: How to Choose the Right Quality Assessment Tool. If you need traceability on key numbers, see: The Most Requested Feature Is Finally Here: Audit Trails.
Can You Just Use a Standard Evidence Table Template?
Only as a starting point.
Templates are useful to avoid blank-page paralysis, but no standard template survives first contact with a real research question.
Every strong evidence table I’ve seen:
- evolved during early extraction,
- reflected the downstream analysis plan,
- and was shaped by what actually mattered to the decision being made.
If you’re early in the process and want a structured way to think through columns before extraction begins, I’ve outlined a practical starting framework in Getting Started with Evidence Tables
Is There Such a Thing as a Perfect Evidence Table?
No.
Evidence tables are fit for purpose, not perfect.
They should originate from:
- the research question,
- the decision context,
- and the planned synthesis.
The goal isn’t elegance. The goal is avoiding rework and protecting confidence.
My Evidence Table Philosophy (After Too Many Painful Projects)
Design for synthesis, and err on the side of extracting too much data rather than too little.
Re-extracting unnecessary columns is annoying. Re-extracting missing outcomes is expensive.
Final Thoughts
Evidence tables sit quietly at the centre of high-stakes decisions in pharma, HTA, and medical devices.
When designed well, they:
- reduce uncertainty,
- support defensible conclusions,
- and make downstream analysis calmer and faster.
When designed poorly, they silently drain time, confidence, and budgets.
If this article nudges you to design your evidence table before you extract a single data point, it has done its job.
And if you’ve ever found yourself halfway through a review thinking “we should have planned this better” , you’re not alone.
That realisation is exactly why I started building tools to make evidence table design more intentional, structured, and far less painful.
Related reading
- Analysis-Driven Design of Evidence Tables
- Best Practices for Data Extraction in Systematic Reviews
- How to Choose Outcomes for an Evidence Table: Quantitative vs Qualitative Reviews
- How Best to Use EvidenceTableBuilder for Systematic Literature Reviews
- The Most Requested Feature Is Finally Here: Audit Trails
Tags:

About the Author
Connect on LinkedInGeorge Burchell
George Burchell is a specialist in systematic literature reviews and scientific evidence synthesis with significant expertise in integrating advanced AI technologies and automation tools into the research process. With over four years of consulting and practical experience, he has developed and led multiple projects focused on accelerating and refining the workflow for systematic reviews within medical and scientific research.