Analysis-Driven Design of Evidence Tables (Without Losing Your Mind Halfway Through)
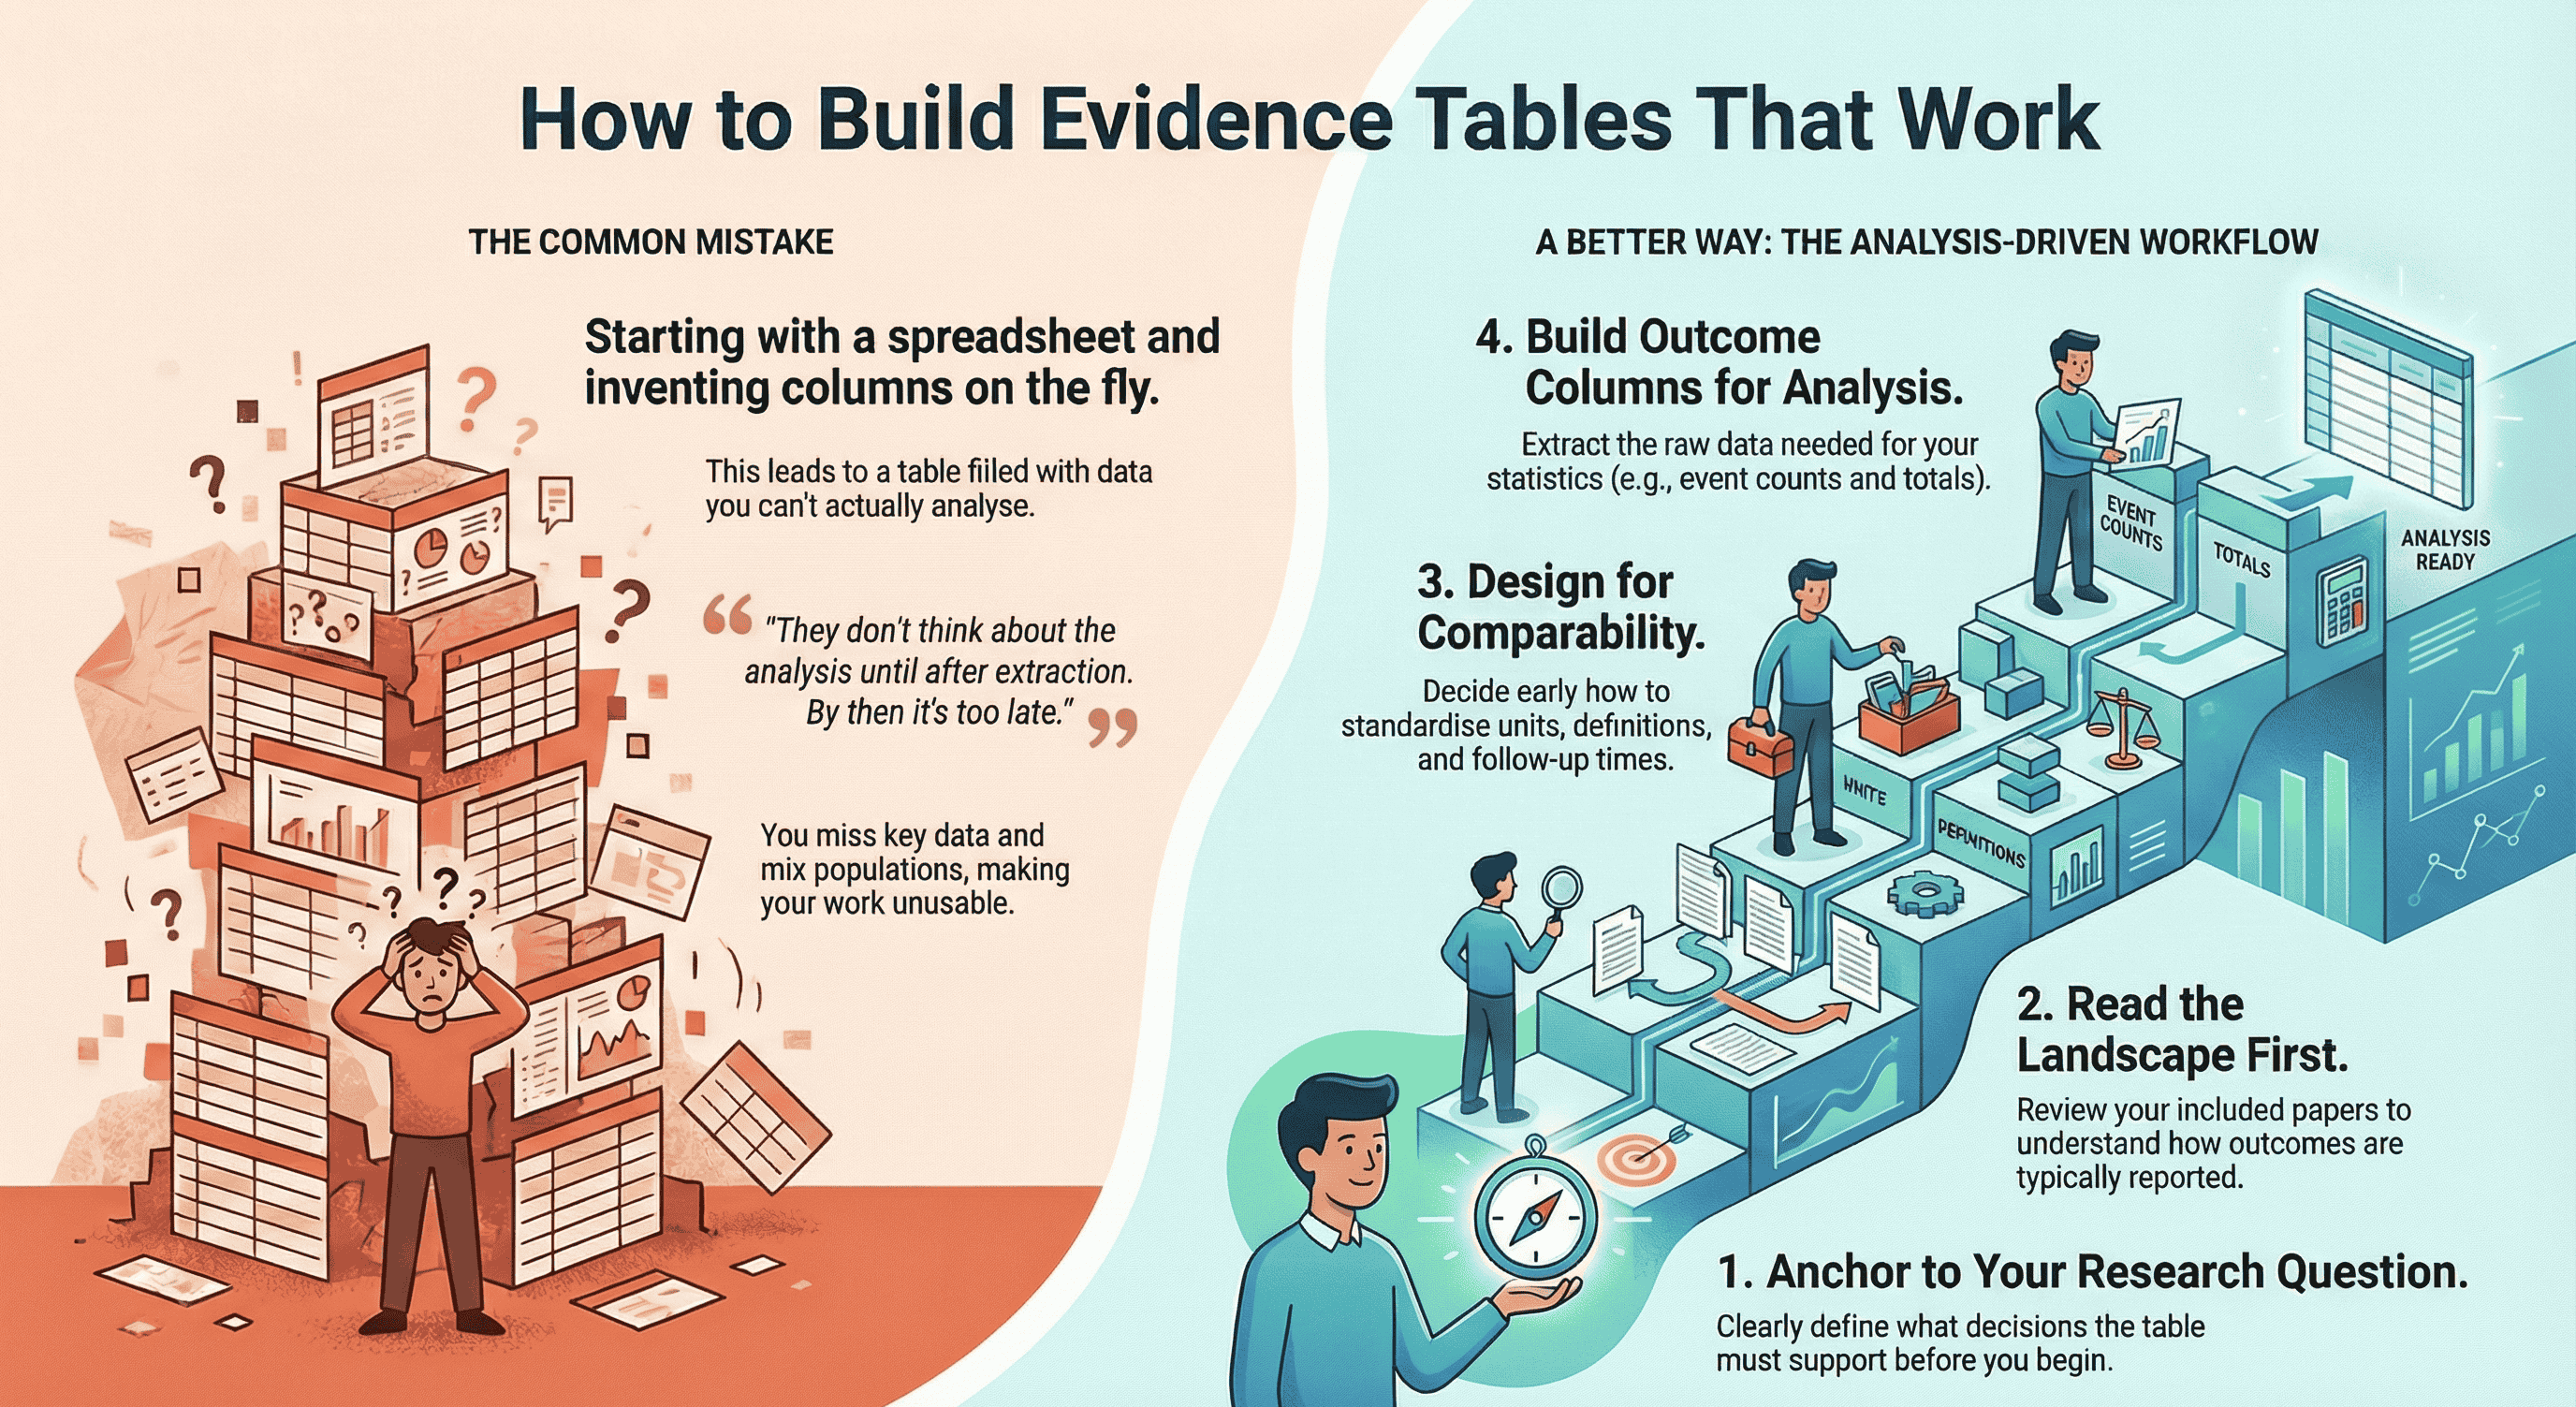
TL;DR: A good evidence table isn't "a big spreadsheet of everything you see in the papers" – it's a table designed backwards from your research question and planned analysis. Start by clarifying what decisions the table needs to support, then:
- Read your included studies to understand how outcomes and timepoints are actually reported.
- Define essential study characteristics, demographics, and outcomes that must be comparable across studies.
- Extract slightly more than you think you need, then clean and standardise units, follow-up times, and definitions so your analysis is actually possible. Tools like EvidenceTableBuilder.com can't decide what matters for your review, but once you've done that thinking, AI can massively speed up the extraction and reduce spreadsheet chaos – especially for busy PhD students, pharma/med-tech teams, and HTA consultants who live and die by the quality of their evidence tables.
When people ask, “How do you construct an evidence table?”, they usually expect a neat, linear recipe.
In reality, the first time I built a proper evidence table, I realised something slightly uncomfortable: it’s very easy to spend days extracting data and still end up with a table you can’t actually analyse.
That was the moment it clicked for me.
Evidence tables aren’t just about “capturing what’s in the papers”.
They’re about designing a structure you can use for comparable analysis later.
This guide is for PhD students, early-career researchers, and the people who manage them – supervisors, PIs, pharma teams, HTA consultants, med-tech clinical leads – anybody who’s sick of wrestling with giant spreadsheets and wants a more deliberate way to build evidence tables.
Why Evidence Tables Are Harder Than They Look
On the surface, an evidence table looks simple:
- One row per study
- Columns for study characteristics
- Columns for outcomes
Job done, right?
Not quite.
I really felt the pain when I was working with a medical device company developing a left atrial appendage sealing device. They needed a full evidence base on:
- Study characteristics
- Patient demographics
- Procedural details
- Short-term complications
- Long-term follow-up
Per paper we were pulling out around 50 data points, including things like:
- Device dislodgement (%)
- Intrahospital stroke/TIA (%)
- Intrahospital ischaemic vs haemorrhagic stroke (%)
- Intrahospital all-cause death (%)
- Intrahospital cardiovascular death (%)
- Procedure-related SAEs
- Follow-up event rates at multiple timepoints
Doing that manually across multiple studies is… character-building.
That project taught me two big lessons:
- If you don’t design the table from the analysis backwards, you’ll drown in data you can’t use.
- The more complex the decision downstream (regulatory, reimbursement, product strategy), the more your table needs to be deliberately structured – not just “filled in”.
Start From the End: Question → Analysis → Data
Most beginners make the same mistake:
They open Excel or a Google Sheet and start inventing columns on the fly.
A much better way to think about it is:
Research question → Planned analysis → Data needed → Evidence table structure
For example, suppose your question is:
“What are the rates of stroke, major bleeding, and all-cause mortality after left atrial appendage closure over 12–24 months of follow-up?”
That already implies:
- You’ll need comparable follow-up time frames (e.g. 12 months, 24 months, or at least something you can convert).
- You’ll need event counts and denominators (not just percentages).
- You’ll want to separate intrahospital events from follow-up events.
- You may need to compare device types, anticoagulation strategies, or patient risk profiles.
So instead of “collect everything and see later”, you ask:
- What exact statistics will my analyst (or future-me) need to run the comparisons?
- What needs to be standardised across studies to make that analysis meaningful?
Only then do you design your table.
If you want a concrete starting point for column headings (before you build your template), this guide is the most practical companion: What Columns Should an Evidence Table for a Systematic Review Include?.
My Workflow for Constructing an Evidence Table
Here’s the process I actually use in real projects, from regulatory submissions to classic academic systematic reviews.
1. Anchor everything to the research question
Write your primary research question at the top of your extraction template.
Then ask:
-
What decisions will this table support?
- Regulatory/HTA?
- Clinical guideline?
- Product strategy in pharma/med-tech?
- A PhD chapter with meta-analysis?
-
What type of synthesis are we aiming for?
- Narrative only
- Meta-analysis
- Subgroup analyses
- Sensitivity analyses
The more quantitative your plan, the more precise your extraction needs to be.
2. Read the landscape before you commit to columns
This is my favourite “simple trick” that changes everything:
Read through the full set of included papers first.
Not in microscopic detail, but enough to understand:
- How outcomes tend to be reported
- Typical follow-up times
- Any weird units or definitions
- Whether there are clear clusters (e.g. device types, risk groups, settings)
Only after that landscape read do I lock in the table structure.
Otherwise you design a template that doesn’t match reality, and then you’re constantly forcing square studies into round columns.
3. Start with study characteristics (always)
I always extract study characteristics first, because they’re the spine of the table.
Typical fields include:
- Citation (first author, year)
- Country / region
- Study design (RCT, cohort, case-control, registry, etc.)
- Setting (hospital, outpatient, community, registry database…)
- Population (inclusion criteria, key exclusion criteria)
- Sample size (total + group sizes if applicable)
- Intervention(s) and comparator(s)
- Follow-up duration (intended and actual)
- Funding / conflicts of interest (if relevant for bias)
These columns do two things:
- They make your table interpretable for anyone reading it.
- They give you the filters you’ll later use for subgroup analysis.
4. Decide what has to be comparable across studies
Next, I think hard about comparability:
-
Are follow-up times reported in days, months, or years?
- Which unit will I standardise to?
-
Are lab values in mg/dL, µmol/L, ng/mL?
- Do I have conversion factors ready?
-
Are outcomes defined consistently?
- e.g. “major bleeding” might use different criteria across trials.
-
Are we mixing:
- Human vs animal studies?
- Adult vs paediatric populations?
- Elective vs emergency procedures?
If you don’t make these decisions early, your evidence table becomes a museum of incomparable numbers.
Sometimes the right move is not to mash everything together, but to:
- Add flags (e.g. “Bleeding definition: ISTH vs BARC”)
- Group similar but not identical outcomes
- Pre-decide which studies can be pooled and which will remain descriptive only
5. Build the outcomes section with the analysis in mind
Now we design the outcome columns.
If you’re not sure which outcomes belong in the table (or how many), choose them based on the synthesis approach: How to Choose Outcomes for an Evidence Table: Quantitative vs Qualitative Reviews.
For each outcome, I ask:
-
What is the primary metric I’ll need?
- Risk ratio, odds ratio, mean difference, hazard ratio, etc.
-
What raw data do I need to calculate that?
- Events + total per arm
- Means, SDs, and sample sizes
- Time-to-event data (if survival analysis is planned)
The columns might look like:
- Outcome: Stroke
- Events (intervention)
- Total (intervention)
- Events (control)
- Total (control)
- Follow-up (months)
- Definition / notes
Repeat for other key outcomes: mortality, bleeding, re-operation, quality-of-life scores, etc.
For more complex medical device or pharma projects, you might have:
- Intrahospital events
- 30-day events
- 6-month events
- 12-month events
- Longest follow-up
Yes, it’s a lot. But this is where a well-designed template (or a tool) saves you hours.
6. Extract more than you think you need (within reason)
One pattern I see again and again in beginners:
They extract too little, not too much.
They’re so worried about “too many columns” that they leave out crucial metadata, and then they can’t run the analysis they actually want.
My rule of thumb:
- Slightly over-extract on the first pass, especially for:
- Demographics (age, sex, baseline risk)
- Key comorbidities
- Dosages and regimens
- Timing and duration of interventions
- Key methodological details (RCT vs observational, blinding, etc.)
You can always hide columns later.
You can’t magic missing data into existence once you’ve closed the PDFs.
7. Clean, standardise, then sanity-check
Once the extraction is done, I do a separate cleaning pass, asking:
- Are units harmonised?
- Are timepoints consistently coded?
- Are there obvious typos (e.g. 1200 patients where it should be 120)?
- Do denominators match the text of the paper?
This is where I’ll convert:
- Months → years
- mg/dL → mmol/L
- “Approximately 1 year” → 12 months (with a note)
Finally, I sanity-check:
- Can I actually answer my research question with this table?
- If I handed this to an analyst or statistician, would they know what to do?
- If a regulator or reviewer asked, “Where did this number come from?”, could I trace it back?
If the answer is “not yet”, I go back and patch the gaps.
The Cochrane Handbook has an excellent section on data extraction and management, which reinforces why planning your template around your analysis is essential.
The Most Common Beginner Mistake
The biggest pattern I see in PhD students and new reviewers is simple:
They don’t think about the analysis until after extraction.
By then it’s too late. You’ve already:
- Missed key timepoints
- Ignored denominators you needed
- Failed to differentiate similar but non-identical outcomes
- Mixed in populations that should have been separated
The fix is not to become a statistician overnight.
It’s to ask, before you extract a single datapoint:
- What comparisons do I care about?
- What subgroups might matter?
- What kind of meta-analysis (if any) are we heading towards?
Even a rough answer will make your evidence table 10x more useful.
A Simple Checklist Before You Start Data Extraction
Here’s the checklist I wish someone had given me before my first “serious” table.
Before you open Excel, Word, Rayyan, Covidence, or anything else, ask:
-
Research question
- Is my primary question written clearly, in one sentence, at the top of the template?
-
Demographics
- Which demographics are essential here?
- Age, sex, baseline risk, disease severity, setting, country/region?
- Which demographics are essential here?
-
Basic metadata
- What simple metadata must I track for every study?
- Study design, sample size, human vs animal, clinical vs experimental, etc. (
- What simple metadata must I track for every study?
-
Comparability
- What do I need to extract to make studies comparable?
- Follow-up times
- Units of measure
- Outcome definitions
- Population type (e.g. only adults, only older adults, mixed)
- What do I need to extract to make studies comparable?
-
Analysis-driven data
- What exact data is needed to answer the research question analytically?
- Event counts and totals?
- Means, SDs, sample sizes?
- Time-to-event data?
- Subgroups I might want to compare?
- What studies from the Evidence Pyramid should i focus on?
- What exact data is needed to answer the research question analytically?
If you can’t answer these yet, you’re not ready to extract.
Do a quick landscape read of your included papers, then come back and refine the template.
Where AI and EvidenceTableBuilder.com Fit In
Manual extraction for something like that left atrial appendage device project is doable – it’s just incredibly laboursome.
You’re flicking between PDFs, copying numbers, worrying you’ve mis-typed “0.8” as “8.0”, and trying to reconcile slightly different follow-up times while your brain slowly melts.
That’s exactly the kind of work where AI can help, as long as you respect the garbage-in, garbage-out principle.
Tools like EvidenceTableBuilder.com don’t magically decide what matters for your review.
You still need to:
- Ask precise questions
- Define your outcomes
- Decide what “comparable” actually means for your topic
But once you’ve done that thinking, AI can:
- Pull structured data from messy PDFs
- Help pre-populate evidence tables
- Reduce the copy-paste grind
- Make it easier to standardise formats
I think of it this way:
Humans decide what should be extracted and why.
AI helps with how fast and how reliably we can do it.
For a single MSc project, that might just mean saving a few weekends.
For a pharma or med-tech team running multiple CERs or HTA submissions in parallel, that’s the difference between drowning in spreadsheets and having a reproducible, auditable pipeline.
For anyone new to systematic reviews, the PRISMA 2020 guidelines provide a clear framework for transparency and reporting, especially when documenting how studies were selected before extraction.
Who Really Benefits From Better Evidence Tables?
This is where decision-makers come in.
The people who feel the downstream pain of messy evidence tables aren’t always the ones doing the extraction. They’re often the ones who have to defend the conclusions:
-
Heads of Evidence & Medical Affairs in pharma companies
needing clean, defensible tables for regulators and payers. -
Clinical evaluation leads in medical device companies
preparing CERs and post-market surveillance reports. -
HTA and market access consultants
building repeated submissions for hospitals, payers, and government bodies. -
Hospital research & guideline teams
trying to move from narrative scoping work to proper structured synthesis. -
PIs and supervisors
overseeing multiple PhD projects and sick of fragile, hand-built spreadsheets.
If you recognise yourself in that list, you’re not just asking:
“How do I construct an evidence table?”
You’re really asking:
“How do we build evidence tables for our team that are reusable, auditable, and scalable?”
That’s where combining clear methodology (everything in this post) with an AI-assisted tool like EvidenceTableBuilder.com becomes powerful:
- An evidence table builder for pharma teams
- An evidence table tool for HTA consultancies and agencies
- An AI-assisted data extraction app for hospitals and academic groups
Same underlying principles. Less chaos. Far fewer headaches.
Final Thought
Constructing an evidence table isn’t a clerical task.
It’s a design exercise.
If you start from the research question and the planned analysis, take time to understand the landscape of your studies, and use a clear checklist before you ever touch a cell, your evidence tables stop being a graveyard of disconnected numbers.
They become what they’re meant to be:
- A bridge between messy reality in the papers and the clear decisions you need to make.
Whether you’re a PhD student doing this for the first time, or a decision-maker responsible for whole pipelines of reviews, the same rule holds:
Design the structure deliberately, then let tools and AI help you fill it – not the other way around.
Related reading
- What Columns Should an Evidence Table for a Systematic Review Include?
- How to Choose Outcomes for an Evidence Table: Quantitative vs Qualitative Reviews
- Best Practices for Data Extraction in Systematic Reviews
- How Best to Use EvidenceTableBuilder for Systematic Literature Reviews
- Automated Data Extraction for Systematic Reviews (HEOR & Market Access)
Tags:

About the Author
Connect on LinkedInGeorge Burchell
George Burchell is a specialist in systematic literature reviews and scientific evidence synthesis with significant expertise in integrating advanced AI technologies and automation tools into the research process. With over four years of consulting and practical experience, he has developed and led multiple projects focused on accelerating and refining the workflow for systematic reviews within medical and scientific research.